Introduction
As the pioneer of the nocturnal remote sensing technology, Earth Observation Group (EOG) had been collecting nighttime satellite imagery and produce global Nighttime Light map with highest quality.
The history of Nighttime Light map produced by EOG can trace back early as 1994, with the Operational Linescan Sensor (OLS) onboard Defense Meteorological Satellite Program (DMSP) satellites. Since the launch of the latest generation of earth observation satellite, the Joint Polar-orbiting Satellite System (JPSS), the Visible and Infrared Imaging Suite (VIIRS) Day Night Band (DNB) on board of JPSS satellites provides astounding improvement on low light imaging compared to DMSP-OLS. EOG is able to make use of this technological advance to provide users with global Nighttime Light products with superior quality.
Monthly Cloud-free DNB Composite
In the monthly cloud-free DNB composites, there are many areas of the globe where it is impossible to get good quality data coverage for that month. This can be due to cloud-cover, especially in the tropical regions, or due to solar illumination, as happens toward the poles in their respective summer months. Therefore, it is imperative that users of these data utilize the cloud-free observations file and not assume a value of zero in the average radiance image means that no lights were observed.
The version 1 monthly series is run globally using two different configurations. The first excludes any data impacted by stray light. The second includes these data if the radiance values have undergone the stray-light correction procedure (Reference). These two configurations are denoted in the filenames as "vcm" and "vcmsl" respectively. The "vcmsl" version, that includes the stray-light corrected data, will have more data coverage toward the poles, but will be of reduced quality. It is up to the users to determine which set is best for their applications.
For each of the months from 2012 - 2020, for the monthly non-tiled versions, the annual v2 masks for each year were applied to all the months for that year. For example, the 2020 lit mask was applied on all the months of 2020. The 2021 annual lit mask is already there on the website, and researchers who are interested may apply the v2 annual lit mask to all the months of 2021. However, we also have the updated v2.1 lit masks for all the years from 2012-2021. Thus, researchers may also apply the v2.1 lit masks on each of the months for each year.
Specifications
| Delivery File Type | (*.tif) Internal DEFLATE compressed GeoTIFF (*.gz) Gzipped GeoTIFF |
| Delivery File Content | avg_rade9h, cf_cvg, cvg |
| Delivery File Config | vcm, vcmsl |
| Unit | (avg_rade9h) nW/cm2/sr |
| Image File Type | GeoTIFF |
| Image CRS | EPSG:4326 (Geographic Latitude/Longitude) |
| Image Resolution | 15 arc second (~500m at the Equator) |
| Tiled | No |
| Coverage | 180W, 75N, 180E, 65S Note: The global coverage of monthly VNL is greatly affected by the length of day in different time of year. In summer time northern hemisphere will have less nighttime coverage due to longer day. |
Annual VNL V1
The annual composites are only made with the “vcm” version, which excludes any data impacted by stray light. Further processing is done on the annual products to screen out ephemeral lights and background (non-lights).
Reference
C. D. Elvidge, K. Baugh, M. Zhizhin, F. C. Hsu, and T. Ghosh, “VIIRS night-time lights,” International Journal of Remote Sensing, vol. 38, pp. 5860–5879, 2017.
Specifications
| Delivery File Tyle | tgz (gzipped tar ball) |
| Delivery File Content | rade9h, cf_cvg, cvg |
| Delivery File Config | vcm, vcm-ntl, vcm-orm, vcm-orm-ntl |
| Unit | (avg_rade9h) nW/cm2/sr |
| Image File Type | GeoTIFF |
| Image CRS | EPSG:4326 (Geographic Latitude/Longitude) |
| Image Resolution | 15 arc second (~500m at the Equator) |
| Tiled | Yes |
| Coverage | 180W, 75N, 180E, 65S |
Annual VNL V2
A new consistently processed time series of annual global VIIRS nighttime lights has been produced from monthly cloud-free average radiance grids spanning 2012* to 2020. The new methodology is a modification of the original method based on nightly data (Annual VNL V1).
* For 2012 annual VNL V2, there are two sets. (A) 201204-201212, and (B) 201204-201303. Only set (B) has masked median and average, as well as lit area mask.
In both methods there is an initial filtering to remove sunlit, moonlit and cloudy pixels, leading to rough composites that contains lights, fires, aurora and background. In the original method, the rough annual composites are made from a full year of nightly DNB data. In the new method, the rough composites are made on monthly increments and then combined to form rough annual composites. Both methods employ outlier removal to discard biomass burning pixels and isolate the background.
In the original method the outlier removal is performed on scattergrams generated for each 15 arc second grid cell, with outliers clipped off from both the high and low radiance sides of the scattergram. The discard of outlier pixels proceeds until the scattergram’s standard deviation stabilizes. The new method uses the twelve-month median radiance to discard high and low radiance outliers, filtering out most fires and isolating the background. Background areas are zeroed out in both methods using the data range (DR) calculated from 3x3 grid cells. In both methods, the DR threshold for background is indexed to cloud-cover levels, with higher DR thresholds in areas having low numbers of cloud-free coverages. In the new method, particular attention is given to setting a single DR threshold for distinguishing lit grid cells from background for each 15 arc second grid cell. This is achieved by setting the DR threshold from a multiyear maximum median and a corresponding multiyear percent cloud-cover grids. The multiyear approach makes it possible to detect lighting present in each 15 arc second grid cell with a single DR threshold across all the years in the series.
Reference
Elvidge, C.D, Zhizhin, M., Ghosh T., Hsu FC, Taneja J. Annual time series of global VIIRS nighttime lights derived from monthly averages:2012 to 2019. Remote Sensing 2021, 13(5), p.922, doi:10.3390/rs13050922
* The latest update is VNL v2.2. Please find the 'readme' for all the versions of Annual VNL v2 HERE
Specifications
| Delivery File Tyle | gz (gzipped) |
| Delivery File Content | average, average-masked, cf_cvg, cvg, max, median, median-masked, min |
| Delivery File Config | vcmslcfg (when available) |
| Image File Type | GeoTIFF |
| Unit | (average, average-masked, max, median, median-masked, min) nW/cm2/sr |
| CRS | EPSG:4326 (Geographic Latitude/Longitude) |
| Resolution | 15 arc second (~500m at the Equator) |
| Tiled | No |
| Coverage | 180W, 75N, 180E, 65S |
Nightly DNB Mosaic and Cloud
Simple mosaic of nightly DNB imagery with later-on-top logic. The pixel value is rounded to 100th place to reduce file volume.
Cloud cover image are taken from VIIRS Cloud Mask, and remapped to three categories.
0-1 -> Clear
2-3 -> Probably Cloudy
4-5 -> Confident Cloudy
Latest file is updated in near real time as new image arrives.
NOTICE: The daily files are internally DEFLATE compressed GeoTIFF files. See here for instruction on how to decompress if your application does not recognize internally compressed GeoTIFF files. QGIS and ArcGIS can read internally compressed GeoTIFF files directly.
Specifications
| Delivery File Tyle | GeoTIFF (internal DEFLATE compressed) |
| Delivery File Content | rade9d (Radiance rounded to 100th place, nW/cm2/sr) vcld (VIIRS Cloud Mask) |
| Unit | (rade9d) nW/cm2/sr |
| Image File Type | GeoTIFF |
| CRS | EPSG:4326 (Geographic Latitude/Longitude) |
| Resolution | 15 arc second (~500m at the Equator) |
| Tiled | No |
| Coverage | 180W, 75N, 180E, 65S |
Nightly DNB Profile and Analysis
EOG has the ability to extract the DNB radiance and other information from every pixel associated with a given coordinate. EOG had developed a series of indices to describe and analyze the character of the nightly DNB profile. Users can explore the existing datasets processed for a collection of areas of interest.
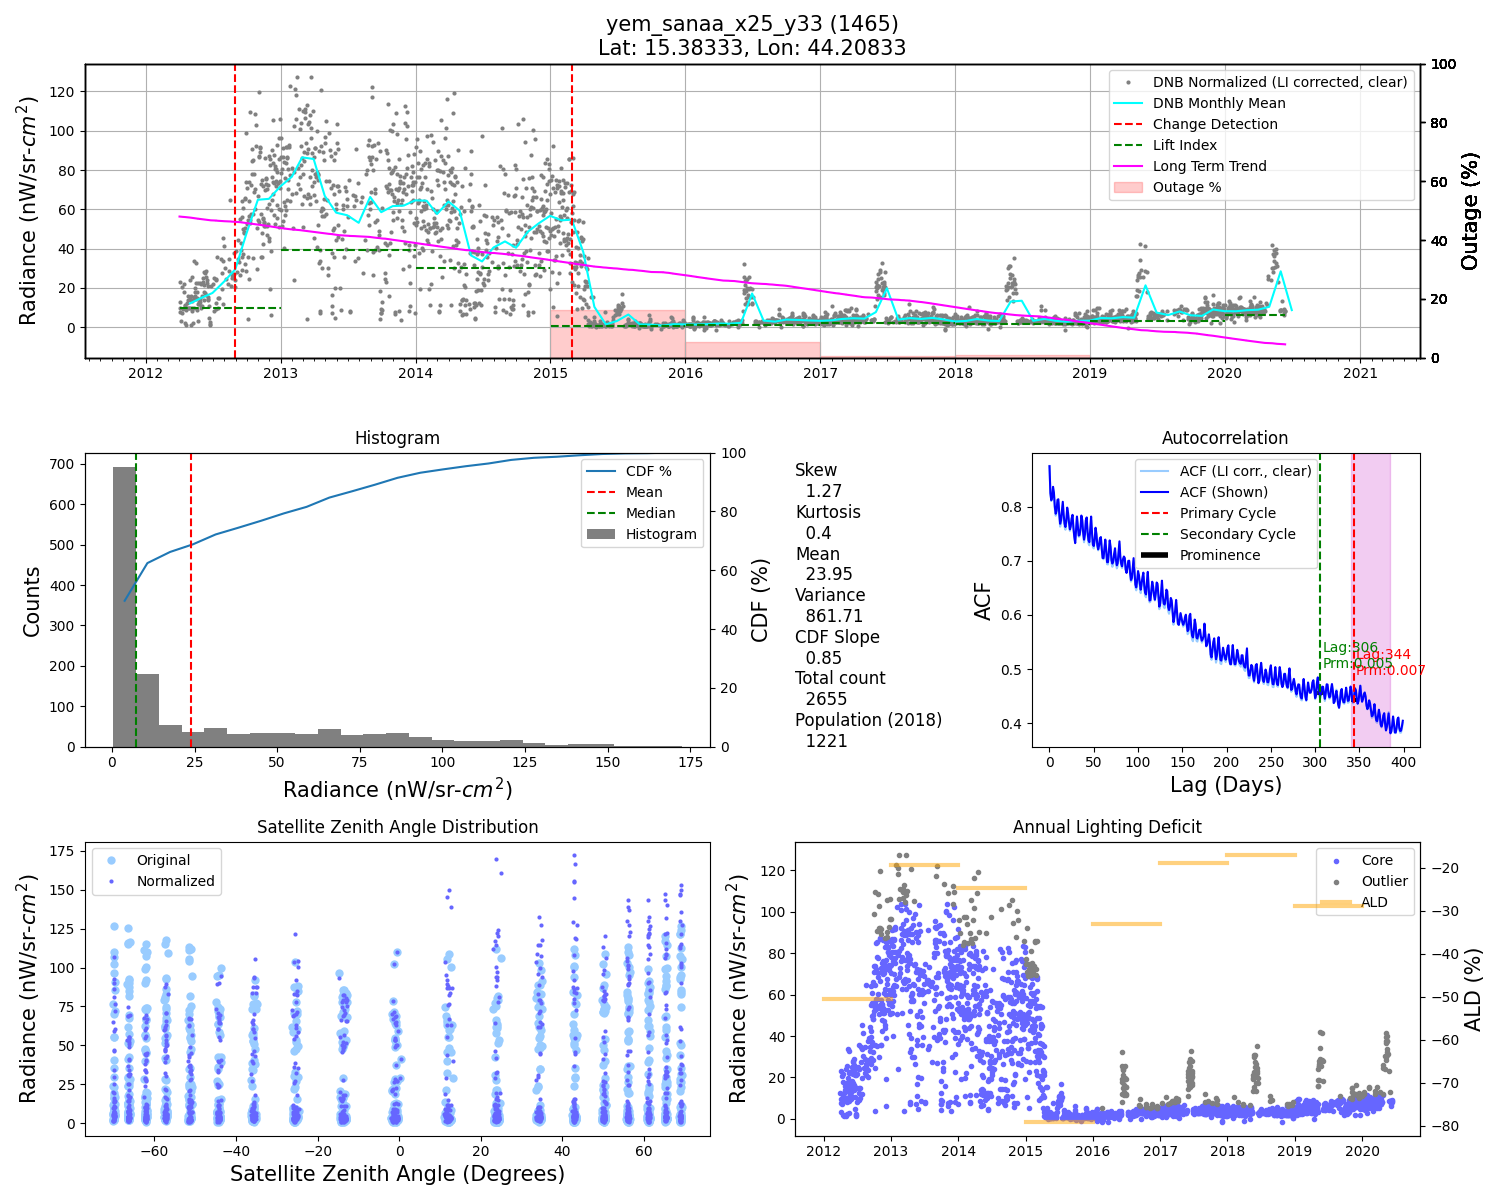
Above is a sample summary image from a grid cell in Sana'a, Yemen. Clear drop of radiance is observed after the aerial strike taken place in April, 2015. Annual peak of radiance during Ramadan is clearly displayed. The radiance is slowly recovering after the strike. These summary images are shown in the KML file for every grid cell in each study area.
For more details on this dataset, please check Readme.
Reference
Elvidge, Christopher D.; Hsu, Feng-Chi; Zhizhin, Mikhail; Ghosh, Tilottama; Taneja, Jay; Bazilian, Morgan. 2020. "Indicators of Electric Power Instability from Satellite Observed Nighttime Lights" Remote Sens. 12, no. 19: 3194.
Temporal Loops
EOG prepared some movie loops for selected regions showcasing how DNB profiles can be visualized.
Open Movie LoopsCountry and City VNL Study
With the large volume of VNL data collected, EOG is able to perform various analysis covering vast area revealing interesting insights over the long time span.
Above is a sample GIF animation showing the annual change of radiance compared to 2012 for Ghana.
For Artists
Nighttime Light is extremely popular in artistic purposes. To correctly show the view at the dark side of the Earth, Nighttime Light is a must-have. Visit the special page for more resources on hi-resolution Nighttime Light for artists.
Above is a 3D rendering of Europe at night using high-resolution Nighttime Light texture as emission source in Blender.
Lumen Watch
EOG is developing prototype service to monitor the change of nighttime light in a given region. The service is called "Lumen Watch". It provides long temporal profile for the region as well as current nightly transect and image preview of the area. This application is particularly useful for monitoring nightly changes for small areas.
Currently EOG has two regions setup for demonstration, which are Rohingya Refugee Camps in Bangladesh, and Jufaynah Camp in Yemen.
Please contact EOG for regions you are interested in to setup a monitoring page.

Above image shows the interface of the VIIRS Lumen Watch service and instructions on how to read the displayed components.
Light Flicker Observed by Satellite
EOG is studying the flicker of electric lighting which can be observed by VIIRS DNB from space.
Chris, Elvidge et al., The VIIRS Day/Night Band: A Flicker Meter in Space?, Remote Sensing, 2022. (Submitted)
Temporal Loops
Check out the movie loops EOG made showcasing how lights changes over time for different regions of interest.
Go To DNB Temporal LoopsFile Manipulation
Unpacking .tgz File
Windows:
Use 7-zip to unpack .tgz file, will result in a .tar file. Use 7-zip to further unpack the .tar file again to access the actual GeoTIFF files.
Mac OS/Linux:
Double click on the .tgz file to unpack. Or use the command tar xzvf <file.tgz> in command line interface (CLI) to un-compress and extract the GeoTIFF files.
Unpacking .gz File
Windows:
Use 7-zip to unpack .gz file.
Mac OS/Linux:
Double click on the .gz file to unpack. Or use the command gunzip <file.gz> in command line interface (CLI) to un-compress and extract the GeoTIFF files.
Unpacking Internal Compressed File
If your GIS software does not recognize internal compressed GeoTIFF file, you can use GDAL to decompress the file to ordinary GeoTIFF file.
Windows:
(1) Install Anaconda.
(2) Create a new environment, install GDAL with GUI. Also you can use the following command in Anaconda Powershell Prompt.conda create -n <env_name>
conda activate <env_name>
conda install -c conda-forge gdal
(3) In Anaconda Powershell Prompt, use following command to decompress. gdal_translate.exe -of GTiff <input_file> <output_file>
Mac OS/Linux:
(1) Install Anaconda.
(2) Create a new environment, install GDAL with GUI. Also you can use the following command in terminal.conda create -n <env_name>
conda activate <env_name>
conda install -c conda-forge gdal
(3) In terminal, use following command to decompress. gdal_translate -of GTiff <input_file> <output_file>
Tiles
For those products that are tiled, they are cropped in 6 tiles as shown below.

File Naming
The GeoTIFF files are named in the following convention.
Example:
Annual VNL V1
SVDNB_npp_20150101-20151231_75N180W_vcm_v10_c201701311200.avg_rade9
[Field1]_[Filed2]_[Filed3]_[Filed4]_[Filed5]_[Filed6]_[Filed7].[Filed8]
Annual VNL V2 (Beta)
VNL_npp_2019_global_average_vcmslcfg_c202010201200
[Field1]_[Field2]_[Field3]_[Field4]_[Field8]_[Field5]_[Field7]
| Field | Definition | |
|---|---|---|
| 1 | Product Type | SVDNB (VNL V1) VNL (VNL V2) |
| 2 | Satellite Name | NPP J01 (NOAA-20) |
| 3 | Date Range | YYYYMMDD-YYYYMMDD (VNL V1) YYYY (VNL V2) |
| 4 | Region of Interest | global Tile ID |
| 5 | Config Short Name | "vcm/vcmcfg" (VIIRS Cloud Mask) contains the "vcm" average, identical to the monthly "vcm" average radiance products. In monthly VNL V1 it applies to those months with no stray light correction available. In annual VNL V1 stray light corrected images are used if possible. "vcmsl/vcmslcfg" (VIIRS Cloud Mask - Stray Light Removed) is only applicable to monthly VNL V1. "vcm-ntl" (VIIRS Cloud Mask - Nighttime Lights) contains the "vcm" average, with background (non-lights) set to zero. "vcm-orm" (VIIRS Cloud Mask - Outlier Removed) contains cloud-free average radiance values that have undergone an outlier removal process to filter out fires and other ephemeral lights. "vcm-orm-ntl" (VIIRS Cloud Mask - Outlier Removed - Nighttime Lights) contains the "vcm-orm" average, with background (non-lights) set to zero. |
| 6 | Version | Product version |
| 7 | Creation Timestamp | In format YYYYMMDDhhmm |
| 8 | Extension | VNL V1 "avg_rade9" Mean radiance, nW/cm2/sr "avg_rade9h" Mean radiance rounded to hundredths place (nW/cm2/sr) "cf_cvg" Cloud-free coverage count "cvg" Coverage count VNL V2 "average" Average monthly radiance, nW/cm2/sr "average-masked" Average monthly radiance w/ background masked, nW/cm2/sr "cf_cvg" Count of cloud free coverage "cvg" Count of coverage "max" Maximum monthly radiance, nW/cm2/sr "median" Median monthly radiance, nW/cm2/sr "median-masked" Median monthly radiance w/ background masked, nW/cm2/sr "min" Minimum monthly radiance, nW/cm2/sr |
Reference
- C. D. Elvidge, K. E. Baugh, M. Zhizhin, and F.-C. Hsu, “Why VIIRS data are superior to DMSP for mapping nighttime lights,” Asia-Pacific Advanced Network 35, vol. 35, p. 62, 2013.
- C. D. Elvidge, K. Baugh, M. Zhizhin, F. C. Hsu, and T. Ghosh, “VIIRS night-time lights,” International Journal of Remote Sensing, vol. 38, pp. 5860–5879, 2017.
- C. D. Elvidge, M. Zhizhin, T. Ghosh, F-C. Hsu, "Annual time series of global VIIRS nighttime lights derived from monthly averages: 2012 to 2019", Remote Sensing, 2021, 13(5), 922.
Credit
When using the data please credit the product generation to the Earth Observation Group, Payne Institute for Public Policy, with proper citations as below.
- Any VNL
C. D. Elvidge, K. E. Baugh, M. Zhizhin, and F.-C. Hsu, “Why VIIRS data are superior to DMSP for mapping nighttime lights,” Asia-Pacific Advanced Network 35, vol. 35, p. 62, 2013. - Annual VNL V1
Elvidge, Christopher D., Kimberly Baugh, Mikhail Zhizhin, Feng Chi Hsu, and Tilottama Ghosh. “VIIRS night-time lights.” International Journal of Remote Sensing 38, no. 21 (2017): 5860-5879. - Annual VNL V2
C. D. Elvidge, M. Zhizhin, T. Ghosh, F-C. Hsu, "Annual time series of global VIIRS nighttime lights derived from monthly averages: 2012 to 2019", Remote Sensing (In press)