Introduction
Since the 1970s, the U.S. Air Force Defense Meteorological Satellite Program (DMSP) has operated satellite sensors capable of detecting the visible and near-infrared (VNIR)
emissions from cities and towns. The DMSP Operational Linescan System (OLS) acquires global daytime and nighttime imagery of the Earth in two spectral bands (VIS and TIR). The
nighttime "VIS" bandpass straddles the VNIR portion of the spectrum (0.5 to 0.9 um). The VIS band signal is intensified at night using a photomultiplier tube (PMT), making it possible to detect faint VNIR emission sources. The PMT system was implemented for the detection of clouds at night. An unanticipated consequence of the nighttime light intensification is the detection of city lights, gas flares, and fires.
Since 1997, EOG had been pioneering in combining the imagery taken by DMSP-OLS to produce global Nighttime Light maps. With annual data stretch from 1992 to 2013, making DMSP Nighttime Light the longest data series available for nocturnal remote sensing on human activities.
Version 4 DMSP-OLS Nighttime Lights Time Series
The files are cloud-free composites made using all the available archived DMSP-OLS smooth resolution data for calendar years. In cases where two satellites were collecting data - two composites were produced. The products are 30 arc second grids, spanning -180 to 180 degrees longitude and -65 to 75 degrees latitude. A number of constraints are used to select the highest quality data for entry into the composites:
Each composite set is named with the satellite and the year (F121995 is from DMSP satellite number F12 for the year 1995). Three image types are available as GeoTIFFs for download from the version 4 composites:
- Data are from the center half of the 3,000 km wide OLS swaths. Lights in the center half have better geolocation, are smaller, and have more consistent radiometry.
- Sunlit data are excluded based on the solar elevation angle.
- Glare is excluded based on solar elevation angle.
- Moonlit data are excluded based on a calculation of lunar illuminance.
- Observations with clouds are excluded based on clouds identified with the OLS thermal band data and NCEP surface temperature grids.
- Lighting features from the aurora have been excluded in the northern hemisphere on an orbit-by-orbit manner using visual inspection.
F1?YYYY_v4b_cf_cvg.tif
Cloud-free coverages tally the total number of observations that went into each 30 arc second grid cell. This image can be used to identify areas with low numbers of observations where the quality is reduced. In some years there are areas with zero cloud- free observations in certain locations.
F1?YYYY_v4b_avg_vis.tif
Raw avg_vis contains the average of the visible band digital number values with no further filtering. Data values range from 0-63. Areas with zero cloud-free observations are represented by the value 255.
F1?YYYY_v4b_stable_lights.avg_vis.tif
The cleaned up avg_vis contains the lights from cities, towns, and other sites with persistent lighting, including gas flares. Ephemeral events, such as fires have been discarded. Then the background noise was identified and replaced with values of zero. Data values range from 1-63. Areas with zero cloud-free observations are represented by the value 255.
Reference
- Elvidge, C. D., Baugh, K. E., Kihn, E. A., Kroehl, H. W., & Davis, E. R. (1997). Mapping city lights with nighttime data from the DMSP Operational Linescan System. Photogrammetric Engineering and Remote Sensing, 63(6), 727-734.
- Baugh, K., Elvidge, C. D., Ghosh, T., & Ziskin, D. (2010). Development of a 2009 stable lights product using DMSP-OLS data. Proceedings of the Asia-Pacific Advanced Network, 30(0), 114.
Specifications
| Delivery File Type | gzipped GeoTIFF Internal DEFLATE compressed GeoTIFF |
| Delivery File Extension | avg_vis (Averaged DN) stable_lights.avg_vis (Stable lights average DN) cf_cvg (cloud free coverage count) cvg (coverage count) lit_mask (Lit area mask) orm_avg_vis (Outlier removed average DN) intercal.stable_lights.avg_vis (Intercalibrated stable lights average DN) |
| Image File Type | GeoTIFF |
| Image CRS | EPSG:4326 (Geographic Latitude/Longitude) |
| Image Resolution | 30 arc second (~1km at the Equator) |
| Coverage | 180W, 75N, 65S, 180E |
Intercalibration
Due to the lack of on-board calibration mechanism, DMSP Nighttime Light product does not report values as radiance, but in digital number (DN). To perform sensible comparison between images of different years, users are encouraged to perform intercalibration before carry out time series analysis.
The coefficient table for intercalibration can be downloaded here.
Average Light X PCT
The nighttime lights product known as avg_lights_x_pct is derived from the average visible band digital number (DN) of cloud-free light detections multiplied by the percent frequency of light detection. The inclusion of the percent frequency of detection term normalizes the resulting digital values for variations in the persistence of lighting. For instance, the value for a light only detected half the time is discounted by 50%. Note that this product contains detections from fires and a variable amount of background noise. This is the product used to infer gas flaring volumes from the nighttime lights.
Reference
- Elvidge, C. D., Baugh, K. E., Kihn, E. A., Kroehl, H. W., & Davis, E. R. (1997). Mapping city lights with nighttime data from the DMSP Operational Linescan System. Photogrammetric Engineering and Remote Sensing, 63(6), 727-734.
- Baugh, K., Elvidge, C. D., Ghosh, T., & Ziskin, D. (2010). Development of a 2009 stable lights product using DMSP-OLS data. Proceedings of the Asia-Pacific Advanced Network, 30(0), 114.
Specifications
| Delivery File Tyle | tgz (gzipped tar ball) |
| Delivery File Extension | avg_lights_x_pct pct_lights |
| Image File Type | GeoTIFF |
| Image CRS | EPSG:4326 (Geographic Latitude/Longitude) |
| Image Resolution | 30 arc second (~1km at the Equator) |
| Coverage | 180W, 75N, 65S, 180E |
Radiance Calibrated
The Operational Linescan System (OLS) flown on the Defense Meteorological Satellite Program (DMSP) satellites, has a unique capability to record low light imaging data at night worldwide. These data are archived at the National Oceanic and Atmospheric Administration (NOAA) National Geophysical Data Center (NGDC). The useful data record stretches back to 1992 and is ongoing. The OLS visible band detector observes radiances about one million times dimmer than most other Earth observing satellites. The sensor is typically operated in a high gain setting to enable the detection of moonlit clouds. However, with six bit quantization and limited dynamic range, the recorded data are saturated in the bright cores of urban centers. A limited set of observations have been obtained at low lunar illumination were obtained where the gain of the detector was set significantly lower than its typical operational setting (sometimes by a factor of 100). By combining these sparse data acquired at low gain settings with the operational data acquired at high gain settings, we have produced a set of global nighttime lights product with no sensor saturation. This product can be related to radiances based on the pre-flights sensor calibration.
Need more info? See Readme.
Reference
- Elvidge, C. D., Baugh, K. E., Dietz, J. B., Bland, T., Sutton, P. C., & Kroehl, H. W. (1999). Radiance calibration of DMSP-OLS low-light imaging data of human settlements. Remote Sensing of Environment, 68(1), 77-88.
- Hsu, F. C., Baugh, K. E., Ghosh, T., Zhizhin, M., & Elvidge, C. D. (2015). DMSP-OLS radiance calibrated nighttime lights time series with intercalibration. Remote Sensing, 7(2), 1855-1876.
Specifications
| Delivery File Tyle | tgz (gzipped tar ball) |
| Delivery File Extension | avg_vis (averaged DN value) cf_cvg (cloud free coverage count) cvg (coverage count) |
| Image File Type | GeoTIFF and ENVI |
| Image CRS | EPSG:4326 (Geographic Latitude/Longitude) |
| Image Resolution | 30 arc second (~1km at the Equator) |
| Coverage | 180W, 75N, 65S, 180E |
Monthly Series
The monthly series of DMSP-OLS composite had been asset users frequently inquire. EOG now makes them available with the best quality configuration available.
The set extends from F10_199204 to F18_201312.
Reference
- Elvidge, C. D., Baugh, K. E., Kihn, E. A., Kroehl, H. W., & Davis, E. R. (1997). Mapping city lights with nighttime data from the DMSP Operational Linescan System. Photogrammetric Engineering and Remote Sensing, 63(6), 727-734.
Specifications
| Delivery File Tyle | GeoTIFF (Internal DEFLATE compressed) |
| Delivery File Extension | avg_vis (averaged DN value) cf_cvg (cloud free coverage count) cvg (coverage count) |
| Image File Type | GeoTIFF |
| Image CRS | EPSG:4326 (Geographic Latitude/Longitude) |
| Image Resolution | 30 arc second (~1km at the Equator) |
| Coverage | 180W, 75N, 65S, 180E |
DMSP Nighttime Lights Extension
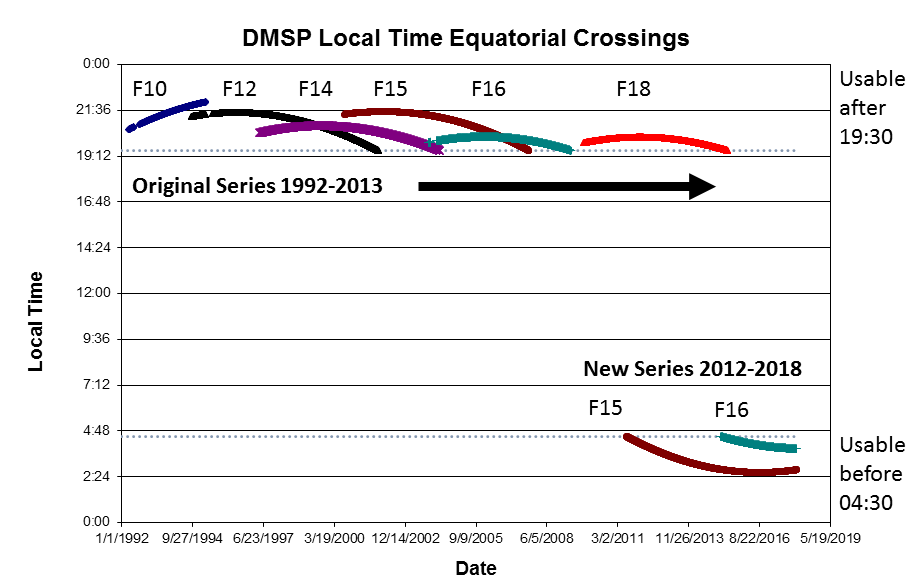
The original global nighttime lights time series from DMSP was produced using OLS data from six individual satellites (Figure 1). Over time, the orbits of each satellite gradually shifts to an earlier overpass time, sliding from a day / night orbit to a dawn / dusk orbit. The DMSP sensors collected sufficient nighttime data worldwide for annual nighttime lights product generation as long as the overpass occurred later than 19:30. Recently, NOAA added additional years to the DMSP equatorial crossing time chart and discovered that the F-15 orbit had continued to shift and had started to collect pre-dawn nighttime data in 2012 and that this continued through 2018. Satellite F16 may have also collected usable nighttime data in the pre-dawn hours.
Based on this new information, EOG has extended the annual DMSP nighttime lights time series out to 2019 using pre-dawn data.
Specifications
| Delivery File Tyle | tgz (gzipped tar ball) |
| Delivery File Extension | avg_vis (averaged DN value) cf_cvg (cloud free coverage count) cvg (coverage count) stable_lights.avg_vis (averaged DN value with ephemeral lights removed) lit_mask (?) |
| Image File Type | GeoTIFF (Internal DEFLATE compressed) |
| Image CRS | EPSG:4326 (Geographic Latitude/Longitude) |
| Image Resolution | 30 arc second (~1km at the Equator) |
| Coverage | 180W, 75N, 65S, 180E |
Acknowledgement
Agence Française de Développement (AFD) funded the research for the extended DMSP series.
Reference
Ghosh, T.; Baugh, K.E.; Elvidge, C.D.; Zhizhin, M.; Poyda, A.; Hsu, F.-C. Extending the DMSP Nighttime Lights Time Series beyond 2013. Remote Sens. 2021, 13, 5004. https://doi.org/10.3390/rs13245004
DMSP-like Nighttime Lights Derived from VNL (DVNL)
We are converting VIIRS radiances to DMSP DNs for two reasons: (1) the saturation limit of the VIIRS sensor is higher than that of the DMSP, and (2) spatial resolution of the VIIRS sensor is five times better than that of the DMSP. For those brightness values that exceed the saturation threshold DMSP, there is nowhere to take values. It is possible to filter out (smooth) high spatial frequencies from the VIIRS image, but there is no deterministic way to add detail to the DMSP one.
Abstract:
Remote sensing of nighttime lights (NTL) is widely used in socio-economic studies of economic growth, urbanization, stability of power grid, environmental light pollution, pandemics and military conflicts. Currently, NTL data are collected with two sensors: (1) Operational Line-scan System (OLS) onboard the satellites from the Defense Meteorology Satellite Program (DMSP) and (2) Visible Infrared Imaging Radiometer Suite (VIIRS) onboard the Suomi NPP (SNPP) and NOAA-20 satellites from the Joint Polar Satellite System (JPSS). However, the nighttime images acquired by these two sensors are incompatible in spatial resolution and dynamic range. To address this problem, we propose a method for the cross-sensor calibration with residual U-net convolutional neural network (CNN). The CNN produces DMSP-like NTL composites from the VIIRS annual NTL composites. The pixel radiances predicted from VIIRS are highly correlated with NTL observed with OLS (0.96 < R2 < 0.99). The method can be used to extend long-term series of annual NTL after the end of DMSP mission or to cross-calibrate same year NTL from different satellites to study diurnal variations.
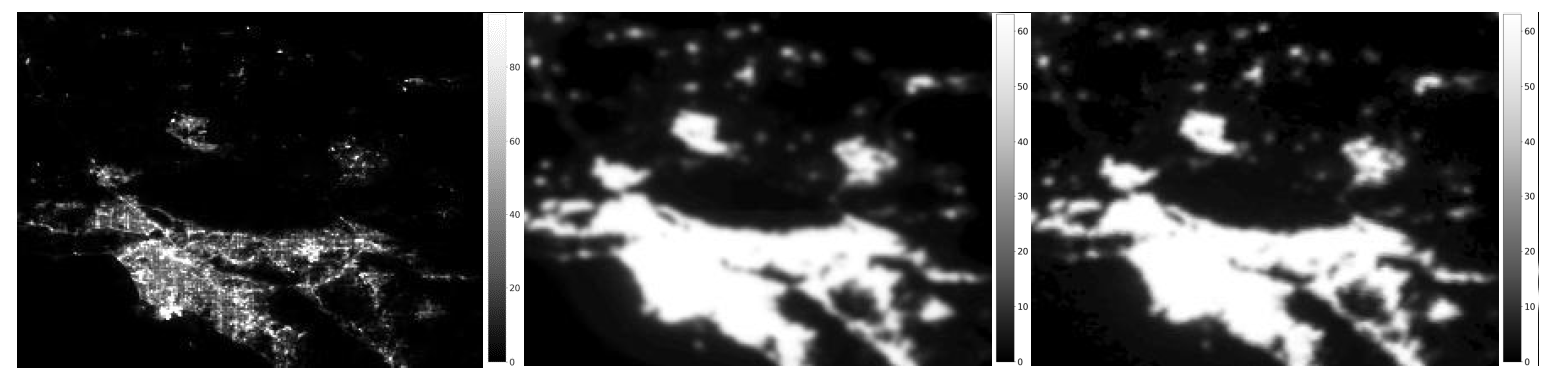
Performance of DVNL over Los Angeles area. Left: VIIRS Nighttime Light (VNL), Middle: CNN generated image from VNL, Right: DMSP-OLS imagery.
Download DVNL SeriesVisit GitHub RepositoryPublicationSpecifications
| Delivery File Tyle | GeoTIFF |
| Delivery File Extension | N/A (average DN equivalent) |
| Image File Type | GeoTIFF (Internal DEFLATE compressed) |
| Image CRS | EPSG:4326 (Geographic Latitude/Longitude) |
| Image Resolution | 30 arc second (~1km at the Equator) |
| Coverage | 180W, 75N, 65S, 180E |
Reference
Nechaev, D.; Zhizhin, M.; Poyda, A.; Ghosh, T.; Hsu, F.-C.; Elvidge, C. Cross-Sensor Nighttime Lights Image Calibration for DMSP/OLS and SNPP/VIIRS with Residual U-Net. Remote Sens. 2021, 13, 5026.
https://doi.org/10.3390/rs13245026
Ghosh, T.; Baugh, K.E.; Elvidge, C.D.; Zhizhin, M.; Poyda, A.; Hsu, F.-C. Extending the DMSP Nighttime Lights Time Series beyond 2013. Remote Sens. 2021, 13, 5004. https://doi.org/10.3390/rs13245004
Download
You can download the data from here.
Version 4 DMSP-OLS Nighttime Lights Time Series
| Year | F10 | F12 | F14 | F15 | F16 | F18 |
|---|---|---|---|---|---|---|
| 1992 | F10_1992 | |||||
| 1993 | F10_1993 |
|||||
| 1994 | F10_1994 |
F12_1994 |
||||
| 1995 | F12_1995 | |||||
| 1996 | F12_1996 |
|||||
| 1997 | F12_1997 |
F14_1997 | ||||
| 1998 | F12_1998 |
F14_1998 | ||||
| 1999 | F12_1999 |
F14_1999 |
||||
| 2000 | F14_2000 |
F15_2000 |
||||
| 2001 | F14_2001 |
F15_2001 |
||||
| 2002 | F14_2002 |
F15_2002 |
||||
| 2003 | F14_2003 |
F15_2003 |
||||
| 2004 | F15_2004 |
F16_2004 |
||||
| 2005 | F15_2005 |
F16_2005 |
||||
| 2006 | F15_2006 |
F16_2006 |
||||
| 2007 | F15_2007 |
F16_2007 |
||||
| 2008 | F16_2008 |
|||||
| 2009 | F16_2009 |
|||||
| 2010 | F18_2010 | |||||
| 2011 | F18_2011* |
|||||
| 2012 | F18_2012 |
|||||
| 2013 | F18_2013 |
|||||
* Currently no lit_mask for F18_2011.
Average Light X PCT
| Year | F10 | F12 | F14 | F15 | F16 | F18 |
|---|---|---|---|---|---|---|
| 1992 | F101992 |
|||||
| 1993 | F101993 |
|||||
| 1994 | F101994 |
F121994 |
||||
| 1995 | F121995 |
|||||
| 1996 | F121996 |
|||||
| 1997 | F121997 |
F141997 |
||||
| 1998 | F121998 |
F141998 |
||||
| 1999 | F121999 |
F141999 |
||||
| 2000 | F142000 |
F152000 |
||||
| 2001 | F142001 |
F152001 |
||||
| 2002 | F142002 |
F152002 |
||||
| 2003 | F142003 |
F152003 |
||||
| 2004 | F152004 |
F162004 |
||||
| 2005 | F152005 |
F162005 |
||||
| 2006 | F152006 |
F162006 |
||||
| 2007 | F152007 |
F162007 |
||||
| 2008 | F162008 |
|||||
| 2009 | F162009 |
|||||
| 2010 | F182010 |
|||||
| 2011 | F182011 |
|||||
| 2012 | F182012 |
|||||
| 2013 | F182013 |
|||||
Radiance Calibrated
| F16_20100111-20110731_rad_v4 |
GeoTIFF | ENVI |
| F16_20100111-20101209_rad_v4 |
GeoTIFF | ENVI |
| F16_20051128-20061224_rad_v4 |
GeoTIFF | ENVI |
| F14_20040118-20041216_rad_v4 |
GeoTIFF | ENVI |
| F14-F15_20021230-20031127_rad_v4 |
GeoTIFF | ENVI |
| F12-F15_20000103-20001229_rad_v4 |
GeoTIFF | ENVI |
| F12_19990119-19991211_rad_v4 |
GeoTIFF | ENVI |
| F12_19960316-19970212_rad_v4 |
GeoTIFF | ENVI |
Unpacking .tgz File
Windows:
Use 7-zip to unpack .tgz file, will result in a .tar file. Use 7-zip to further unpack the .tar file again to access the actual GeoTIFF files.
Mac OS/Linux:
Double click on the .tgz file to unpack. Or use the command tar xzvf <file.tgz> in command line interface (CLI) to un-compress and extract the GeoTIFF files.
Unpacking Internal Compressed File
Internal compressed GeoTIFF allows software to access pixels directly while keeping the file size small. If your GIS software does not recognize internal compressed GeoTIFF file, you can use GDAL to decompress the file to ordinary GeoTIFF file.
Windows:
(1) Install Anaconda.
(2) Create a new environment, install GDAL with GUI. Also you can use the following command in Anaconda Powershell Prompt.conda create -n <env_name>
conda activate <env_name>
conda install -c conda-forge gdal
(3) In Anaconda Powershell Prompt, use following command to decompress. gdal_translate.exe -of GTiff <input_file> <output_file>
Mac OS/Linux:
(1) Install Anaconda.
(2) Create a new environment, install GDAL with GUI. Also you can use the following command in terminal.conda create -n <env_name>
conda activate <env_name>
conda install -c conda-forge gdal
(3) In terminal, use following command to decompress. gdal_translate -of GTiff <input_file> <output_file>
DMSP Documents
| Title | Author | Date | |
|---|---|---|---|
| AFGWC Defense Meteorological Satellite Program (DMSP) Simple Format Users' Guide | AFGWC | 1996/11/21 | Download |
| The Brightness of Lights on Earth at Night, Digitally Recorded by DMSP Satellite | Thomas A. Croft/USGS | 1979/8 | Download |
| DMSP Bevel Values | Naval Space Command | 1997/3/18 | Download |
| The DMSP Block 5 Program History at Westinghouse and Northrop Grumman - As Remembered by some Participants | M. J. Spangler/Westinghouse Electric Corporation | 2003/10 | Download |
| Interface Specification for DMSP Block 5D-2 Spacecraft (S11-S14) to Operational Linescan System to Mission Sensors | DMSP Space Segment Integrator/GE | 1988/8/26 | Download |
| Defense Meteorological Satellite Program - Block 5D Launch | N/A | 1980/6/3 | Download |
| DMSP Data Specifications | DMSP HQ and Missile System Organization / USAF | 1975/10/15 | Download |
| DMSP Data Specifications | Westinghouse Electric Corporation | 1993/4/28 | Download |
| DMSP Interface Specification for DMSP Block 5D-3 Spacecraft (S16-S20) to Operational Linescan System to Mission Sensors | Lockheed Martin Missiles & Space | 1998/2/27 | Download |
| Defense Meteorological Satellite Program (DMSP) User's Guide | Air Weather Service (MAC) USAF | 1974/12/1 | Download |
| DMSP Compendium of Early Satellites | Space and Missile Systems Organization Air Force Systems Command USAF | 1975/11 | Download |
| DMSP Data Specification OLS 5D-2 |
DMSP HQ Space and Missile Systems Organization Airforce Systems Command | 1977/1/15 | Download |
| DMSP Data Archive Data Format Handbook | Harris Government Information System Division | Circa 1980 | Download |
| DMSP Flight Number and Year Lookup | N/A | Circa 1993 | Download |
| DMSP Primary Sensor Data Aquisition | Westinghouse Defense and Electronic Systems Center | Circa 1990 | Download |
| DMSP Processing Guide | N/A | 1992/3/30 | Download |
| Relative Calibration of the DMSP Operational Linescan System (OLS) Thermal Fine Data | Space Systems Group The Aerospace Corporation |
2000/1 | Download |
| Satellite Data Services Files (DMSP) | N/A | N/A | Download |
| DMSP Smooth Data File Format (Excerpted from other documents) | N/A | N/A | Download |
| Defense Meteorological Satellite System System Requirements Document Volume III Technology Development Plan |
System Integration Directorate DMSP Office The Aerospace Corporation |
1985/5/1 | Download |
| Defense Meteorological Satellite System System Requirements Document Volume I |
Advanced Technology Branch DMSS Program Office | 1988/10/31 | Download |
| Data Management Plan for the Archive of OLS and Space Environment Data Received from AFGWC on Magnetic Tape | National Geophysical Data Center | 1992/6/11 | Download |
| OLS L Channel Gain Correction for Non-Lambertian Scenes | Westinghouse Electric Corporation | 1987/6/29 | Download |
| OLS #7A Acceptance Test Result Vol I/IV Summary and Specification Requirements |
Westinghouse Electric Corporation | 1982/3/1 | Download |
| (F12) OLS #12 Bearing Retrofit Acceptance Test Report Vol I/III Summary and Specification Requirements |
Westinghouse Electric Corporation | 1992/3/20 | Download |
| OLS #13 Acceptance Test Report Vol I-III/IV Summary and Specification Requirements |
Westinghouse Electric Corporation | 1987/10/21 | Download |
| (F13) OLS #14 Bearing Retrofit Acceptance Test Report Vol I/III Summary and Specification Requirements |
Westinghouse Electric Corporation | 1993/5/28 | Download |
| (F13) OLS #14 Bearing Retrofit Acceptance Test Report Vol III/III Summary and Specification Requirements |
Westinghouse Electric Corporation | 1993/5/28 | Download |
| (F14) OLS #15 Bearing Retrofit Acceptance Test Report Vol I/IV Summary and Specification Requirements |
Westinghouse Electric Corporation | 1988/12/9 | Download |
| (F16) OLS #19 Acceptance Test Report Vol I/IV |
Northrop Grumman Systems Corporation | 2002/9/9 | Download |
| (F18) OLS #20 Acceptance Test Report Vol I/IV Summary and Specification Requirements |
Westinghouse Electric Corporation | 1995/5/1 | Download |
| (F17) OLS #21 Acceptance Test Report Vol I/IV Summary and Specification Requirements |
Westinghouse Electric Corporation | 1995/2/1 | Download |
| Scene Spatial Resolution Uniformity Along Scan; Rotation and Switching of Detector Field of View (One page, excerpted) | Westinghouse Electric Corporation | N/A | Download |
| Support of Environmental Requirements for Cloud Analysis and Archive (SERCAA): Algorithm Descriptions | Atmospheric and Environmental Research, Inc. | 1994/3/28 | Download |
| Specification for DMSP SIMPLE Data format for NAVAF METSAT Phase I | HQ AFGWC/DOX | 1995/11/20 | Download |
| Technical Operating Report Block 5D-3 Operational Linescan System (OLS) |
Westinghouse Electric Corporation | 1989/4/1 | Download |
| The Defense Meteorological Satellite Program Sensors: An Historical Overview | Technology Development and Plans System Engineering Division | 1992/3 | Download |
Reference
- C. D. Elvidge, K. Baugh, M. Zhizhin, F. C. Hsu, and T. Ghosh, “VIIRS night-time lights,” International Journal of Remote Sensing, vol. 38, pp. 5860–5879, 2017.
- C. D. Elvidge, K. E. Baugh, M. Zhizhin, and F.-C. Hsu, “Why VIIRS data are superior to DMSP for mapping nighttime lights,” Asia-Pacific Advanced Network 35, vol. 35, p. 62, 2013.
- Elvidge, C. D., Baugh, K. E., Dietz, J. B., Bland, T., Sutton, P. C., & Kroehl, H. W. (1999). Radiance calibration of DMSP-OLS low-light imaging data of human settlements. Remote Sensing of Environment, 68(1), 77-88.
- Hsu, F. C., Baugh, K. E., Ghosh, T., Zhizhin, M., & Elvidge, C. D. (2015). DMSP-OLS radiance calibrated nighttime lights time series with intercalibration. Remote Sensing, 7(2), 1855-1876.
Credit
Whenever using or distributing DMSP data or derived images, use the following credit:
Image and data processing by Earth Observation Group, Payne Institute for Public Policy, Colorado School of Mines. DMSP data collected by US Air Force Weather Agency.